

TL;DR overview
- SonarQube code coverage measures how much of the codebase is exercised by automated tests, surfacing coverage gaps that could hide bugs or vulnerabilities.
- Configuring coverage in SonarQube requires an external test runner (such as JaCoCo for Java) to generate a report that SonarQube then imports and displays.
- Coverage thresholds can be set in quality gates to block code from advancing through the pipeline if test coverage falls below an acceptable level.
- Visualizing coverage trends in SonarQube over time helps teams maintain standards and identify areas of the codebase that need additional testing.
Introduction
Ensuring your code is thoroughly tested allows you to update it with confidence, as failing tests will quickly identify any functional issues. It also helps maintain the overall quality and reliability of your software.
One critical metric to gauge the effectiveness of your testing efforts is code coverage.
SonarQube Server, a powerful automated code review solution, integrates seamlessly with test coverage tools, empowering developers to write higher quality, more secure, and thoroughly tested code.
SonarQube Server supports reporting, monitoring, and visualizing code coverage, helping teams maintain high code quality standards.
This article delves into how code coverage works in SonarQube Server, and also applies to SonarQube Cloud, covering its setup, analysis, and interpretation.
What is Code Coverage?
Code coverage, also called test coverage, measures the percentage of your codebase exercised by your automated tests. It highlights which parts of the codebase are covered by tests, which are not, and which parts have partial coverage, thereby providing insights into potential areas needing better test coverage.
Low code coverage indicates areas where bugs or vulnerabilities might lurk undetected, posing potential risks in production environments.
Typically, code coverage metrics include:
- Overall Coverage: The percentage of overall code executed by tests.
- Line Coverage: The percentage of lines of code executed by tests.
- Branch Coverage: The percentage of control flow branches (if statements, loops, etc.) executed by tests.
Setting Up Code Coverage in SonarQube Server
SonarQube Server serves as a central hub that integrates seamlessly with popular code coverage tools. It gathers and presents coverage reports alongside static code analysis results, providing clear pass/fail metrics to ensure your code meets quality standards.
Once you have set up a third-party tool to produce the report, simply configure the SonarScanner to tell where the reports are located so that it can pick them up and send them to SonarQube Server.
It supports importing coverage data in formats specific to various popular testing tools and languages.
For tools not directly supported, SonarQube Server offers a generic format.
SonarQube Server supports many programming languages, including Java, C/C++, JavaScript, Python, .NET, and PHP. To enable coverage reporting, you must then do the following:
- Run Coverage Tool: Set up your coverage tool to run before the SonarScanner analysis as part of your build pipeline.
- Match Report Format: Configure your coverage tool's output format to match what the SonarScanner expects. For instance, in a Maven-based Java project, you can use the JaCoCo plugin to produce coverage reports.
- Set SonarScanner Parameters: Configure the SonarScanner analysis parameters for test coverage with the coverage report locations to import the generated report files.
During each build, your coverage tool collects coverage data and outputs results to one or more files (typically separate files for test coverage).
Then, the SonarScanner, as part of its analysis process, imports those files and sends the results to SonarQube Server.
SonarQube Server seamlessly imports coverage data from various tools and languages. It also supports a generic format for custom conversion, ensuring compatibility with even unsupported tools.
Detailed guides for the following languages are available:
- Java test coverage
- JavaScript/TypeScript test coverage
- .NET test coverage
- Python test coverage
- PHP test coverage
- C/C++/Objective-C test coverage
Analyzing Code Coverage in SonarQube Server:
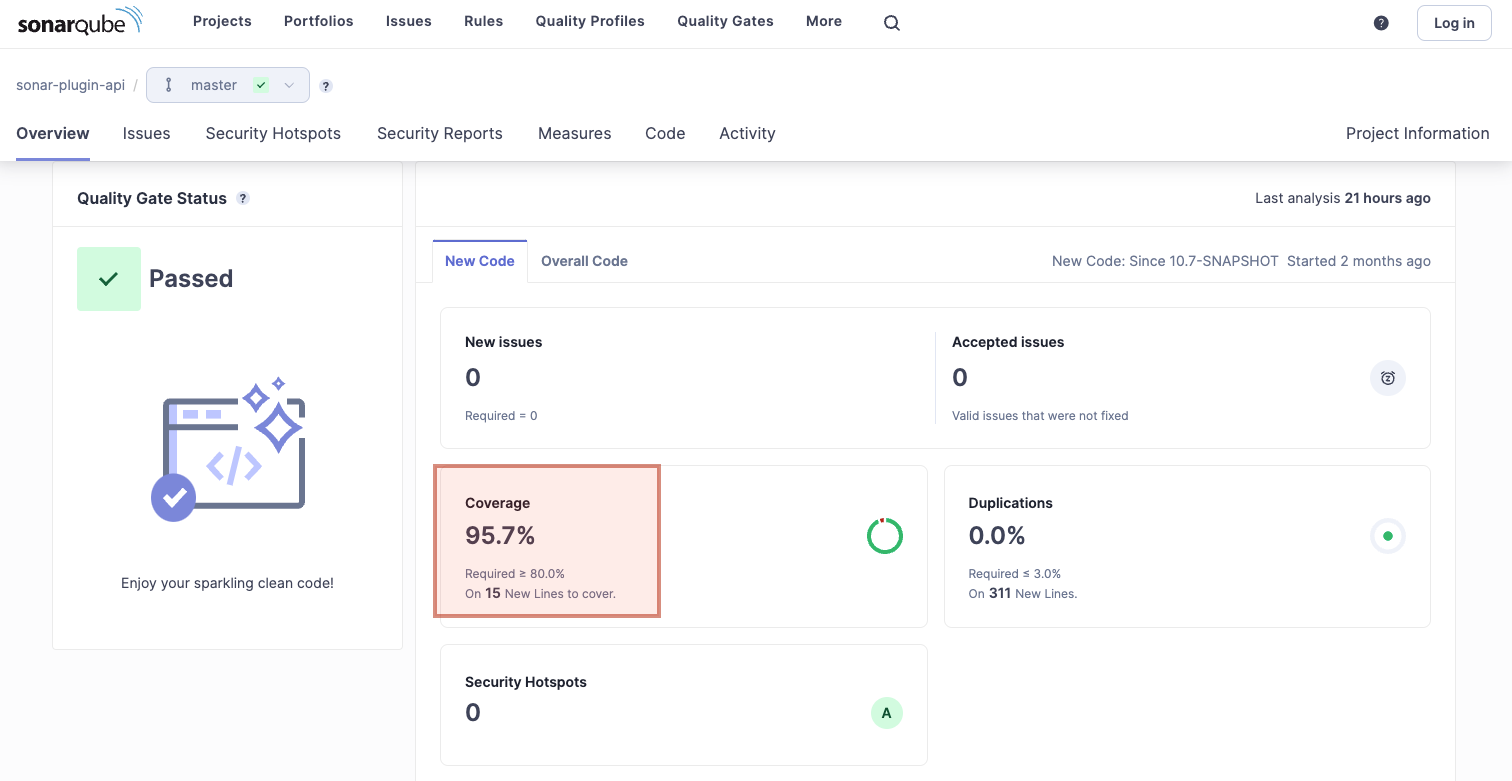
Once your setup is complete and SonarQube Server analysis runs, you can view the code coverage results in SonarQube Server. Key areas to explore include:
- Project Overview: The dashboard provides a high-level view of overall code coverage, including line, branch, and method coverage percentages.
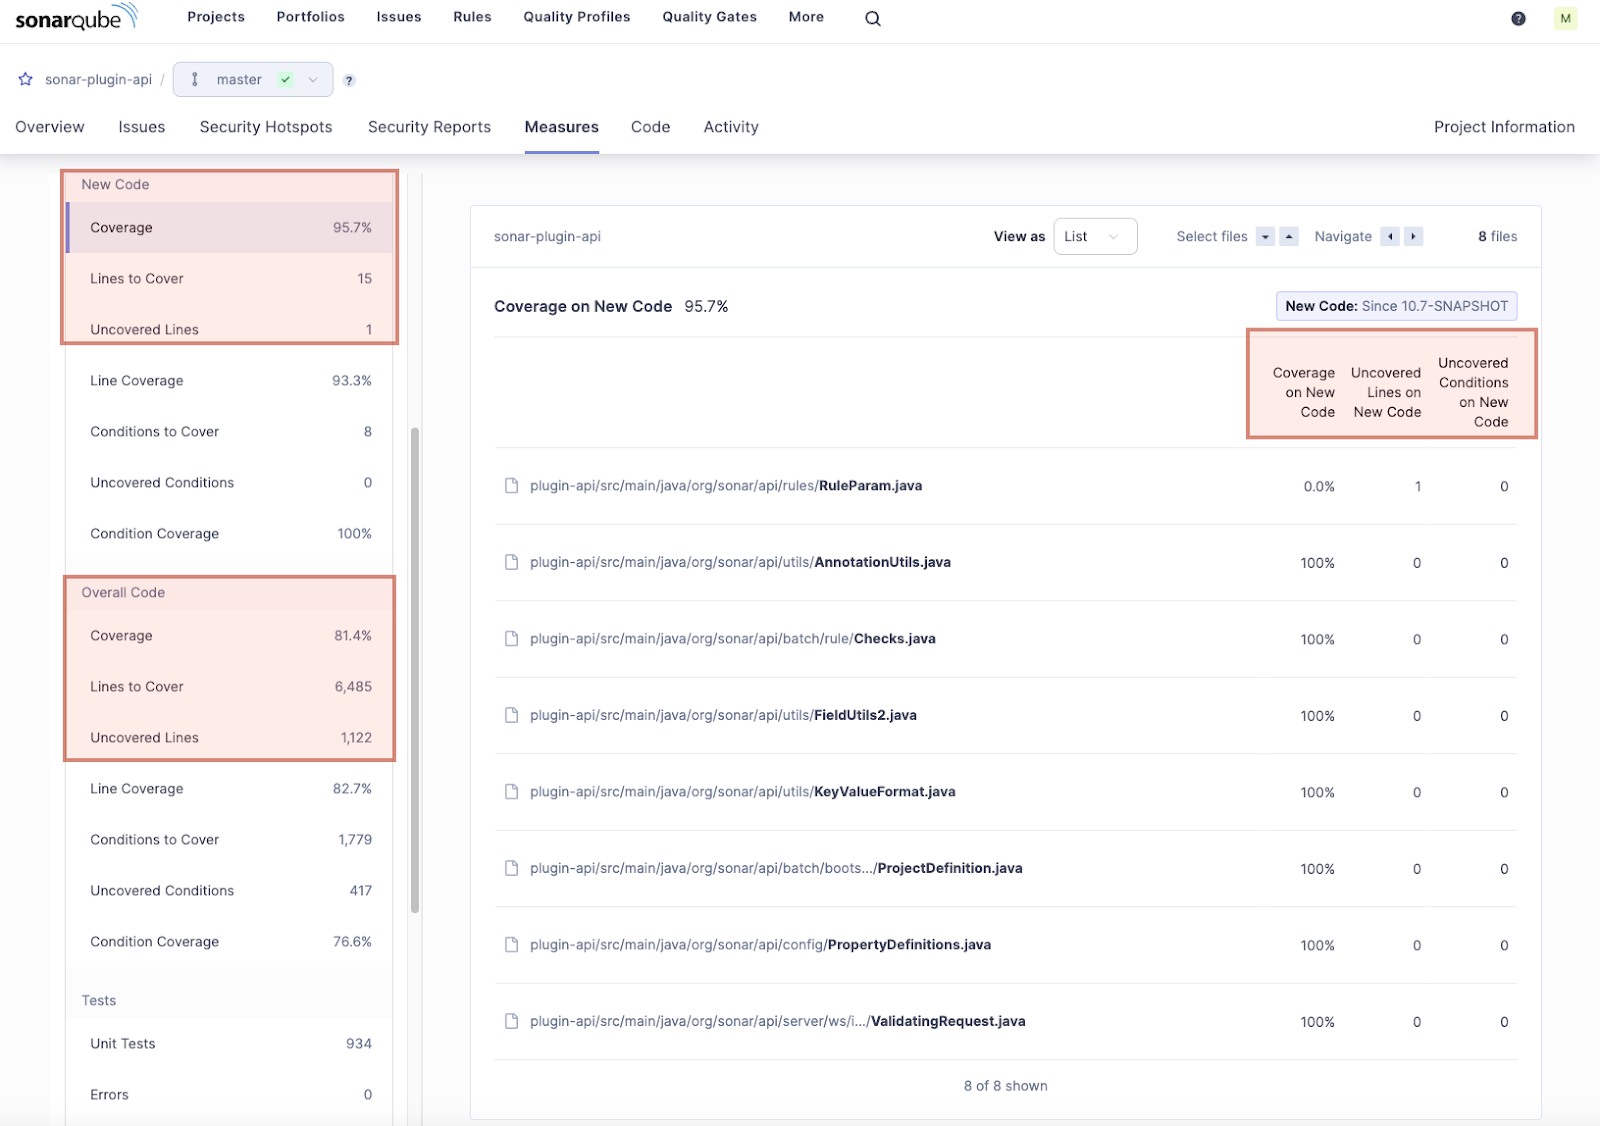
- Coverage Drill-Down: You can drill down into specific modules, packages, and classes to see detailed coverage metrics. This helps identify untested code sections that might need additional tests. The coverage metrics are available for both the new and overall code.
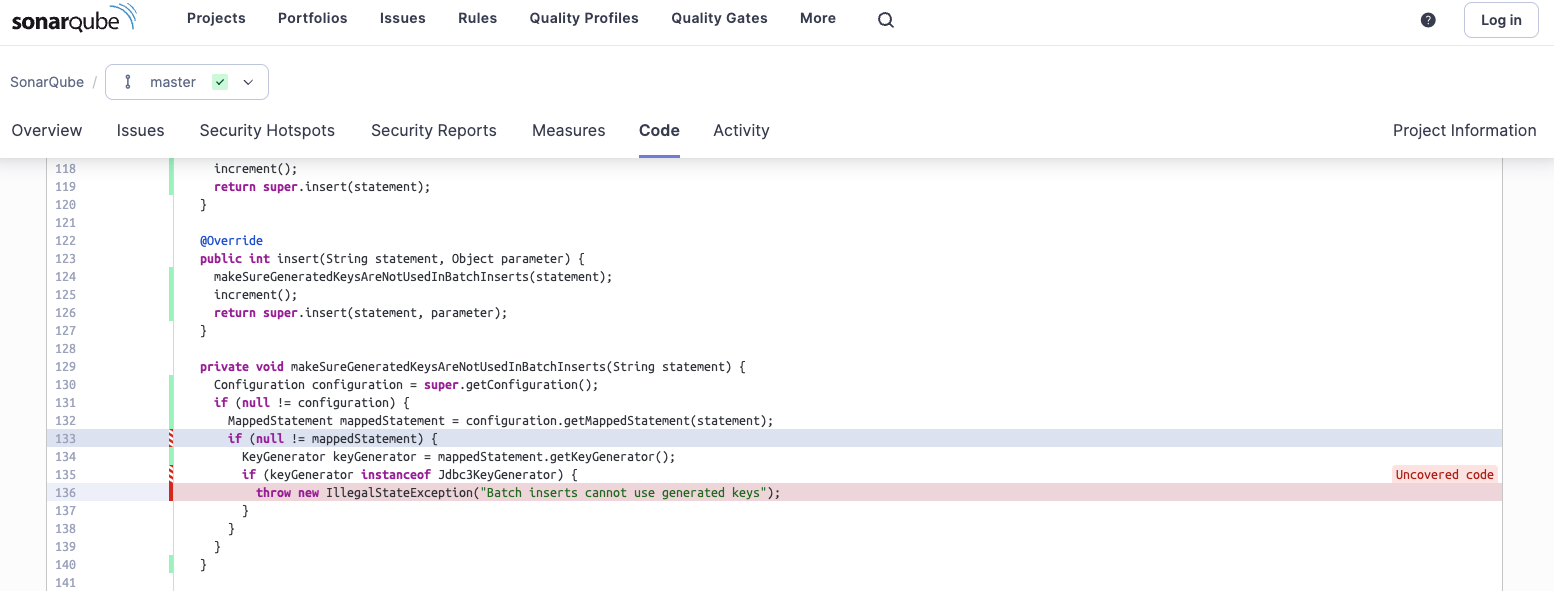
You can also see the coverage annotations in the file context that show whether the code is covered, partially covered, or not covered by unit tests.
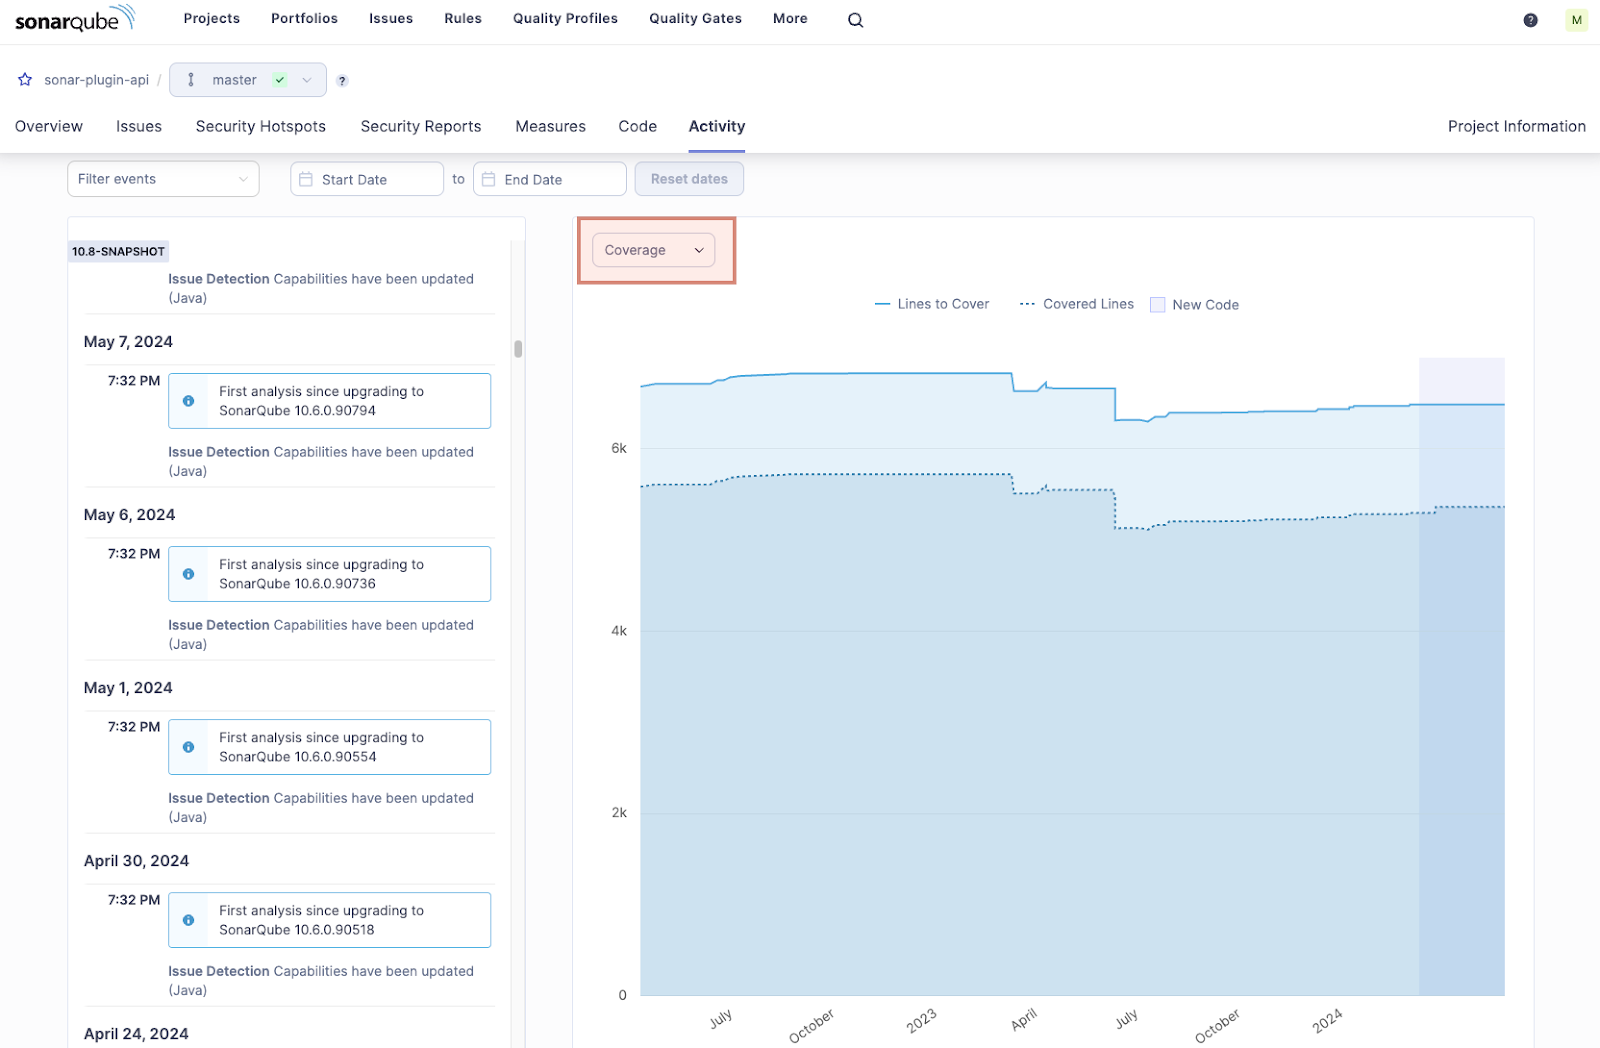
- Coverage Evolution: SonarQube Server tracks coverage over time, allowing you to monitor improvements or regressions in your test coverage across different versions and commits.
Interpreting Code Coverage Metrics
While code coverage is a vital metric, focusing on 100% code coverage may get to a point of diminishing returns. Here are some guidelines to interpret it:
- High Coverage Does Not Equal High Quality: High code coverage does not guarantee high-quality tests. Ensure your tests cover edge cases and potential failure points.
- Strive for Meaningful Coverage: Aim for coverage that provides confidence in your code's behavior rather than focusing solely on achieving a high percentage.
- Balance Coverage with Other Metrics: Code coverage should be considered alongside other quality metrics provided by SonarQube Server, such as code smells, bugs, and security vulnerabilities.
Benefits of Using SonarQube Server for Code Coverage Analysis
- Improved Reliability and Maintainability: Higher code coverage indicates that more code paths are being exercised by your tests, leading to the identification and remedying of bugs earlier in the development lifecycle.
- Increased Developer Confidence: A significant advantage of code coverage is the confidence it gives you to make changes. With code coverage, you can immediately see the impact of your changes: if there are any unintended side effects, tests will break right away. This instant feedback helps catch problems early and ensures the stability of your codebase. A well-tested codebase with high code coverage instills confidence in developers and reduces the fear of introducing new bugs in production.
- Detailed Reports: SonarQube Server offers granular code coverage reports that pinpoint untested sections of your code. These reports break down coverage by lines and files, providing a clear picture of your testing efforts. Code coverage reports help demonstrate the quality and thoroughness of the testing process to stakeholders and potential customers.
- Actionable Insights: Beyond simply reporting coverage percentages, SonarQube Server offers actionable insights within the context of your codebase. It highlights areas with low coverage, providing metrics such as uncovered lines and uncovered conditions. Refer to the documentation for all the metrics that SonarQube Server reports for test coverage.
Sonar and Code Coverage:
SonarQube Server empowers developers to achieve comprehensive code coverage, giving them clear visibility into untested areas and offering actionable insights with context.
It equips developers by providing a quantitative measure of testing effectiveness.
This data helps teams track progress toward testing goals and make informed decisions about resource allocation for testing activities.
By integrating coverage analysis into your development workflow, you can ensure your codebase is well-tested and maintain high standards of quality.
Remember, while code coverage is important, it should be part of a broader strategy for continuous code quality improvement.
Ready to Leverage SonarQube Server for Code Coverage Analysis? Try Developer Edition for yourself.